
We have managed Google Ads since 2013 — more than $13 million in ad spend across a book that has grown 1,600+ accounts — and more than a hundred accounts ran under our manager account in the twelve months this report covers. We pulled all of them, kept only the ones where a clean comparison to the industry benchmark is possible, and published what came out: eleven industries, one method, one year, including the four accounts that cost more per lead than the average. This is our own book, not a market study, and the accounts in it are businesses that chose to hire us and stayed. Read it as a working record of what twelve months of disciplined management produced, not as a claim about what Google Ads costs everyone.
How we measured
The benchmark is WordStream’s 2026 Google Ads search benchmarks: 13,474 US search campaigns, April 1 2025 through March 31 2026, an overall average cost per lead of $66.69, with per-industry averages (WordStream). We set our window to exactly those dates so the comparison is like for like. Our side is every account under our manager account, search campaigns only — WordStream measures search, so Performance Max, Display, Video, Smart and Demand Gen campaigns are excluded from our figures too.
A lead, for this report, is a conversion action that represents a person asking to be contacted: a call from the ad or the website, a completed form, a booked appointment, or an eligibility quiz that starts a case. Starting from the 100-plus accounts in the window, we opened the conversion-action report for every one and removed the accounts whose primary conversion is something else. The four largest convert on completed sales — plan purchases and phone sales — which belong in a return-on-spend study, not a cost-per-lead one. Three more count something that is not a lead: a language school whose “conversions” are clicks on a class-registration button, a rental business that counts completed rentals, and a service business whose self-assessment quiz was being counted twice. Those rows are out, not because they are bad accounts, but because a cost per rental in a cost-per-lead column would tell you nothing. We also dropped anything paused or too small to read — under $1,000 of spend or fewer than 10 conversions in the window — which is most of the remainder.
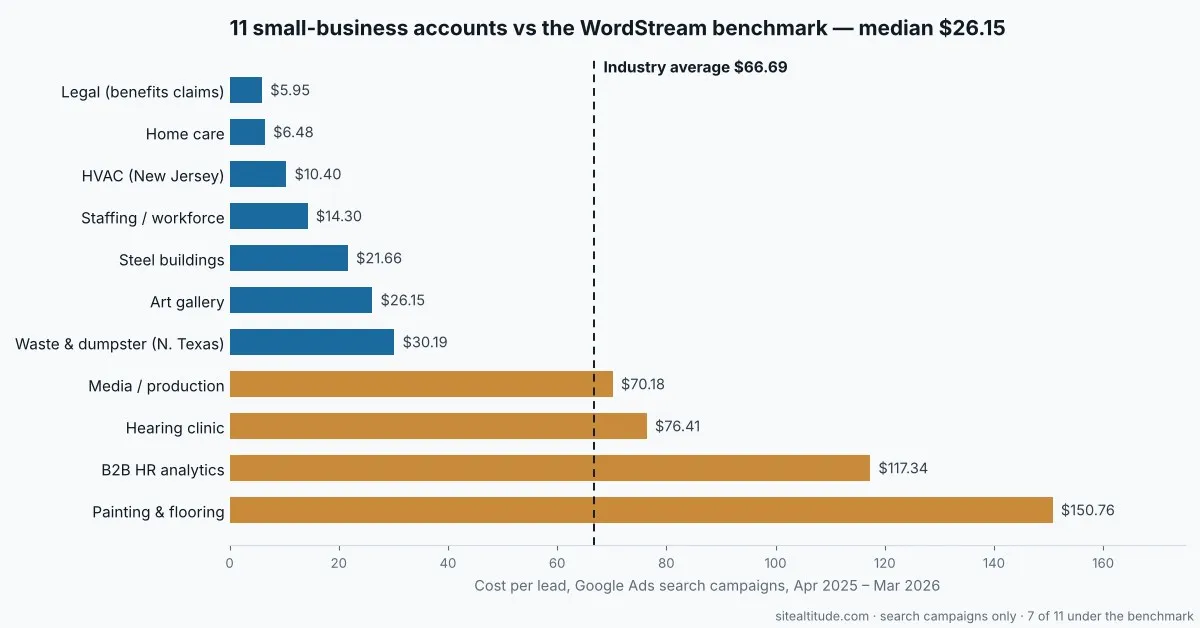
That leaves 11 accounts in 11 different industries, $389,186 of spend and 13,850 leads: the part of the book where the comparison is clean. We report medians rather than averages, because one booked-appointment account pulls the mean to $48.17 and that number would mislead you in the other direction.
The headline numbers
| Our accounts (search only) | WordStream average | Gap | |
|---|---|---|---|
| Median cost per lead, 11 accounts | $26.15 | $66.69 | 61% lower |
| Aggregate cost per lead ($389,186 / 13,850 leads) | $28.10 | $66.69 | 58% lower |
| Accounts beating the overall benchmark | 7 of 11 | — | — |
| Home & home improvement, 3 accounts ($302,730, 8,170 leads): median | $30.19 | $90.92 | 67% lower |
| Home & home improvement: aggregate | $37.05 | $90.92 | 59% lower |
Every row in the table is a different industry, which is the breadth of the book and also the reason category averages are scarce here: home services and business services are the only categories with three accounts, and three is the floor for quoting a category figure at all. In business services our median was $70.18 against WordStream’s $93.69 — 25% lower, and the narrowest gap in the set. Every other category here has one account, which is why they appear below as individual rows and never as an average.
The same cut across thirteen years
The twelve-month window is the fair comparison, but it is a slice of a much longer record. Run the same exclusions across everything we have managed since 2013 and the picture holds: 33 accounts, a median cost per lead of $32.45, and 26 of the 33 under $66.69.
Treat that comparison loosely. WordStream’s $66.69 is a 2025–26 figure, and holding 2014 spend against it is not a fair test — click prices have moved a long way since — and we did not re-open the conversion-action report for accounts that closed years ago. The lifetime cut is useful for scale, not for benchmarking. The twelve-month window above is the honest comparison.
Every account, one row each
Search campaigns only, April 2025 through March 2026, sorted by spend. Accounts are identified by industry. No client is named.
| # | Industry | Spend | Leads | Our cost per lead | Category average | Result |
|---|---|---|---|---|---|---|
| 1 | Waste & dumpster services (North Texas) * | $149,777 | 4,961 | $30.19 | $90.92 | 67% lower |
| 2 | Painting & flooring † | $128,445 | 852 | $150.76 | $90.92 | 66% higher |
| 3 | HVAC (New Jersey) * | $24,509 | 2,357 | $10.40 | $90.92 | 89% lower |
| 4 | B2B HR / talent analytics | $24,172 | 206 | $117.34 | $93.69 | 25% higher |
| 5 | Steel buildings / construction | $18,878 | 872 | $21.66 | $75.19 | 71% lower |
| 6 | Staffing / workforce | $12,956 | 906 | $14.30 | $93.69 | 85% lower |
| 7 | Legal (benefits claims) | $12,809 | 2,154 | $5.95 | $131.63 | 95% lower |
| 8 | Home care | $8,642 | 1,333 | $6.48 | $54.60 | 88% lower |
| 9 | Art gallery | $3,511 | 134 | $26.15 | $26.84 | at benchmark |
| 10 | Hearing clinic | $3,171 | 42 | $76.41 | $40.04 | 91% higher |
| 11 | Media / production services | $2,316 | 33 | $70.18 | $93.69 | 25% lower than category, above the $66.69 overall |
* See the notes below — these two accounts also appear in published case studies with different figures. † Of this account’s 852 leads, 415 are booked estimate appointments, 233 are instant-quote requests and 136 are calls from the ad. Most of the table counts a form fill or a call; this row mostly counts a person on a calendar.
Four of the 11 came in above the $66.69 benchmark. One has a reason worth naming. The painting and flooring account’s main conversion is a booked estimate, which is a far higher bar than a form submission; $150.76 for a scheduled appointment and $90.92 for a form are not the same event. We have left it in the table at its real number rather than quietly reclassifying it.
The other three have no such excuse. The B2B HR and talent analytics account ran $117.34 against a $93.69 category average, on a niche audience with a long sales cycle and not enough search volume to prune our way out of it. The hearing clinic ran $76.41 against $40.04 on a budget too small to give the bidding much to learn from — 42 leads over twelve months is thin. And the media and production account, at $70.18, sits below its own category average but above the overall benchmark; it is a $2,316 account, and at that size a single quiet month moves the number.
Those three are the honest answer to “does this always work.” It does not. What we can say is that when it does not, we can tell you why, which is a different thing from not knowing.
Notes on two of these accounts
Two rows in that table belong to businesses with published case studies, and the case study numbers are better than the report numbers. That is not a contradiction, and it is worth spelling out before someone assumes one set is wrong. The North Texas waste and dumpster case study reports 13,278 leads at $16.76 — a different twelve-month window, and it includes the Performance Max campaign that this report excludes. Row 1 above is search campaigns only, over WordStream’s window, at $30.19. The New Jersey HVAC case study reports 1,375 leads in a single month at $2.85 and 5,665 leads at $7.63 across 2025. Row 3 is again search only over the benchmark window, at $10.40. Both sets of figures are true. They measure different campaigns over different months, and the report uses the narrower cut because that is the only cut that can be compared to a search-only benchmark.
What the accounts that beat the benchmark have in common
There is no clever tactic in the seven that won. There are five habits, and every one of them is available to you whether you hire anyone or not.
Conversion tracking that measures a lead, not a signal of interest. This is the one that decides everything downstream, and it is the reason three accounts came out of this report before a single number was calculated. If your conversion action fires on a page view, a button click, or a PDF download, your cost per lead will look wonderful and mean nothing — and worse, Google’s bidding will spend your budget chasing more of it. Every account in the top half of that table counts a call, a completed form, or a booked appointment. Nothing softer. Pick the strictest definition your volume can support, write it down, and check quarterly that it still fires after a website change.
A deliberate choice between search and Performance Max, not a default. Performance Max is not the enemy, but it is opaque, and it will happily absorb budget that a search campaign was converting more cheaply. The accounts that hold a low cost per lead tend to keep search as the accountable core, where you can see the query that produced the lead, and use Performance Max as an addition with its own budget and its own read — not as a replacement you stop looking inside.
Negative keywords added every week, not every quarter. Waste compounds quietly. A search terms report read weekly costs you fifteen minutes and catches the drift while it is still small; the same report read in April tells you what you wasted since January. This is the single most boring item on the list and the one that separates the accounts most reliably.
Landing pages that load fast and ask for one thing. You are paying full price for every click regardless of what happens after it. A page that takes four seconds on a phone has already lost a share of the traffic you bought, and a page offering five different next steps converts worse than one that offers the obvious one. When an account’s cost per lead will not come down and the search terms are clean, the page is usually the reason.
Cost per lead reviewed weekly, out loud, by a named person. Not clicks. Not impressions. Not a monthly PDF nobody reads. The accounts that stay cheap are the accounts where someone looks at the cost per lead every week and has to explain it when it moves. Discipline is the whole product here, and a recurring calendar slot is most of the discipline.
What to do with this
If you are running ads yourself, take the five habits above and check your account against them this week. Start with the conversion action, because if that one is wrong the rest of the numbers are decoration.
If you want to see how we do the work, our Google Ads management page sets out what the fee covers and how we report. If you are weighing the cost of help, we published the pricing models and what a management fee should include in how much Google Ads management costs, and the case for not hiring anyone at all in whether to hire a Google Ads agency or run ads yourself.
Or book a 20-minute call and we will look at your account and tell you where your cost per lead sits against this table — including if the answer is that you do not need us.